Speed Index
The Speed Index is the average time at which visible parts of the page are displayed. It is expressed in milliseconds and dependent on size of the view port.
The Speed Index metric was added to WebPageTest in April, 2012 and measures how quickly the page contents are visually populated (where lower numbers are better). It is particularly useful for comparing experiences of pages against each other (before/after optimizing, my site vs competitor, etc) and should be used in combination with the other metrics (load time, start render, etc) to better understand a site's performance.
The Problem
Historically we have relied on milestone timings to determine how fast or slow web pages were. The most common of these is the time until the browser reaches the load event for the main document (onload). The load event is easy to measure both in a lab environment and in the real world. Unfortunately, it isn't a very good indicator of the actual end-user experience. As pages grow and load a lot of content that is not visible to the user or off the screen (below the fold) the time to reach the load event is extended even if the user-visible content has long-since rendered. We have introduced more milestones over time to try to better represent the timings (time to first paint, time to DOM content ready, etc) but they are all fundamentally flawed in that they measure a single point and do not convey the actual user experience.
Introducing the Speed Index
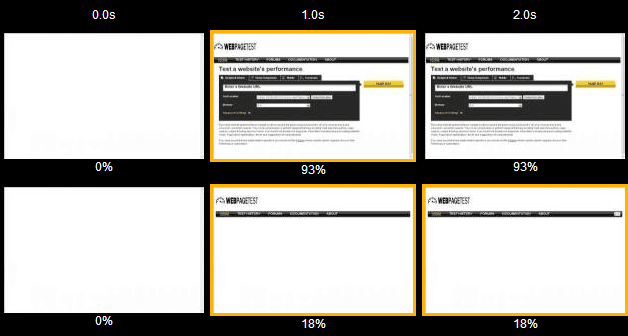
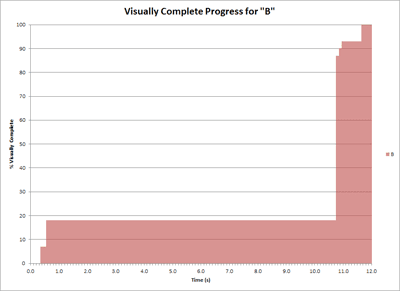
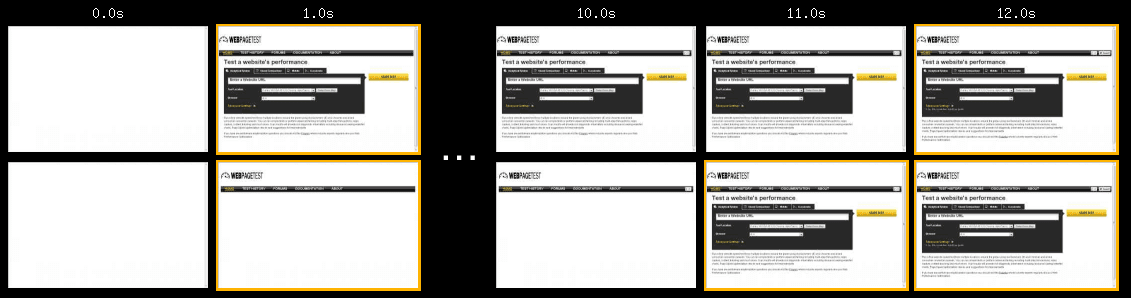
The speed index takes the visual progress of the visible page loading and computes an overall score for how quickly the content painted. To do this, first it needs to be able to calculate how "complete" the page is at various points in time during the page load. In WebPageTest this is done by capturing a video of the page loading in the browser and inspecting each video frame (10 frames per second in the current implementation and only works for tests where video capture is enabled). The current algorithm for calculating the completeness of each frame is described below, but for now assume we can assign each video frame a % complete (numbers displayed under each frame):
If we plot the completeness of a page over time we will end up with something that looks like this:
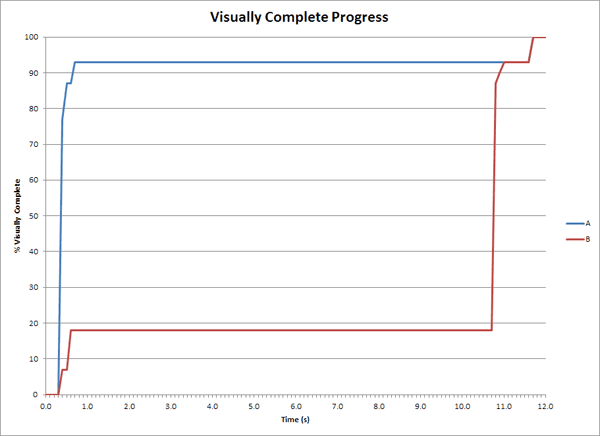
We can then convert the progress into a number by calculating the area under the curve:
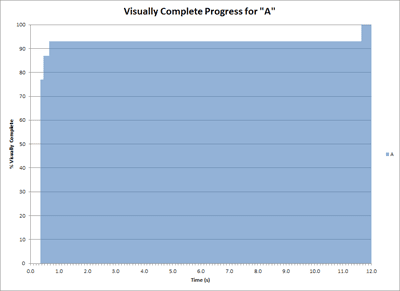
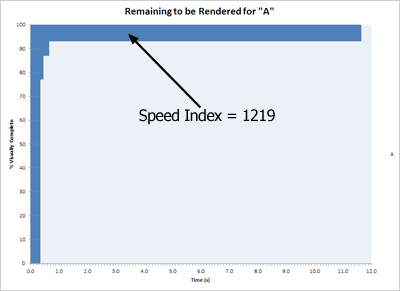
This would be great except for one little detail, it is unbounded. If a page spins for 10 seconds after reaching visually complete the score would keep increasing. Using the "area above the graph" and calculating the unrendered portion of the page over time instead gives us a nicely bounded area that ends when the page is 100% complete and approaches 0 as the page gets faster:
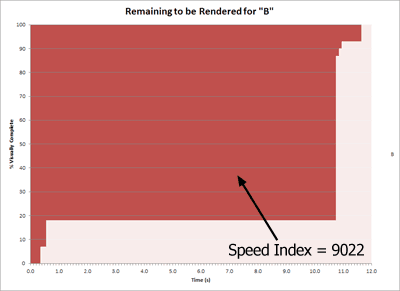
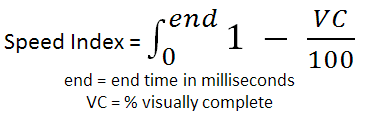
The Speed Index is the "area above the curve" calculated in ms and using 0.0-1.0 for the range of visually complete. The calculation looks at each 0.1s interval and calculates IntervalScore = Interval * (1.0 - (Completeness/100)) where Completeness is the % Visually complete for that frame and Interval is the elapsed time for that video frame in ms (100 in this case). The overall score is just a sum of the individual intervals: SUM(IntervalScore)
For comparison, this is what the video frames looked like for the two pages ("A" is on top and "B" is on the bottom):
Measuring Visual Progress
I kind of hand-waved over how the "completeness" of each video frame is calculated and the calculating of the Speed Index itself is independent of the technique used for determining the completeness (and can be used with different methods of calculating completeness). We have two methods available that we are currently working with:
Visual Progress from Video Capture
A simplistic approach would look at each pixel of the image and compare it to the final image and then calculate the % of pixels that match for each frame (perhaps also ignoring any pixels that match between the beginning and ending frames). The main problem with this approach is that web pages are fluid and things like an ad loading can cause the rest of the page to move. In a pixel-comparison mode this would look like every pixel on the screen changed, even if the actual content just shifted down a single pixel.
The technique we settled on was to take histograms of the colors in the image (one each for red, green and blue) and just look at the overall distribution of colors on the page. We calculate the difference between the starting histograms (for the first video frame) and the ending histogram (last video frame) and use that difference as the baseline. The difference of the histogram for each frame in the video versus the first histogram is compared to the baseline to determine how "complete" that video frame is. There are some cases where it will not really be accurate but the trade-off has proved to be very worthwhile for the vast majority of pages we have tested it against.
This is the original mechanism that was used to calculate visual progress when the Speed Index was initially created and still works well but there are some cases where it has problems (video playing on pages, slideshows animating or large interstitials). It is very sensitive to the end state and calculates the progress based on the final image. It is also only measurable in a lab and relies on video capture being possible.
Visual Progress from Paint Events
More recently we have (successfully) experimented with using the Paint Events that are exposed by Webkit through the developer tools timeline (which are also available to extensions and through the remote debugging protocol). It is available on all recent webkit-based browsers including desktop and mobile and across all platforms. It is also very lightweight and does not require capturing video. It is somewhat sensitive to the renderer implementation in a given browser so it is not as useful for comparing performance across different browsers.
In order to get useful data, it requires a fair bit of filtering and weighting.
The specific algorithm we are using to calculate the speed index from the dev tools paint rects is:
- In the case of Webkit-based browsers, we collect the timeline data which includes paint rects as well as other useful events.
- We filter out any paint events that occur before the first layout that happens after the first response data is received.
- ResourceReceiveResponse -> Layout -> Paint events.
- This is done because the browser does several paint events before any data has actually been processed.
- We group all paint events by the rectangle that they are updating (frame ID, x, y, width, height).
- We consider the largest paint rectangle painted to be the "full screen" rectangle.
- Each rectangle contributes a score towards an overall total. The available points for a given rectangle is that rectangle's area (width x height).
- Full screen paints (any paint events for the largest rectangle) are counted as 50% so that they still contribute but do not dominate the progress.
- The overall total is the sum of the points for each rectangle.
- The points for a given rectangle are divided evenly across all of the paint events that painted that rectangle.
- A rectangle with a single paint event will have the full area as it's contribution.
- A rectangle with 4 paint events will contribute 25% of it's area for each paint event.
- The endTime for any given paint event is used for the time of that paint event.
- The visual progress is calculated by adding each paint event's contribution to a running total, approaching the overall total (100%).
Reference Speed Index Results
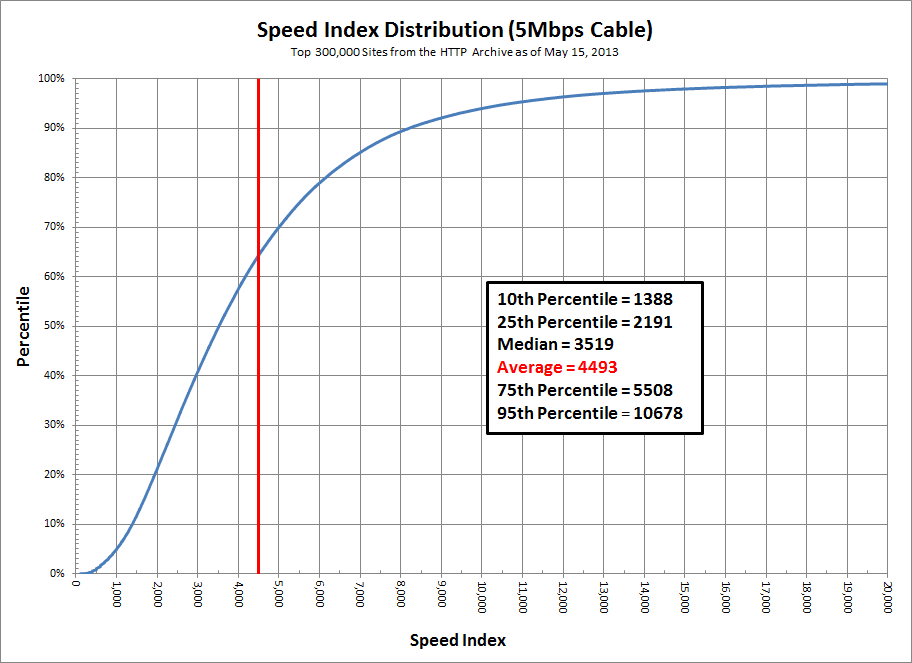
5Mbps Cable
Alexa top 300,000 from the testing done by the HTTP Archive:
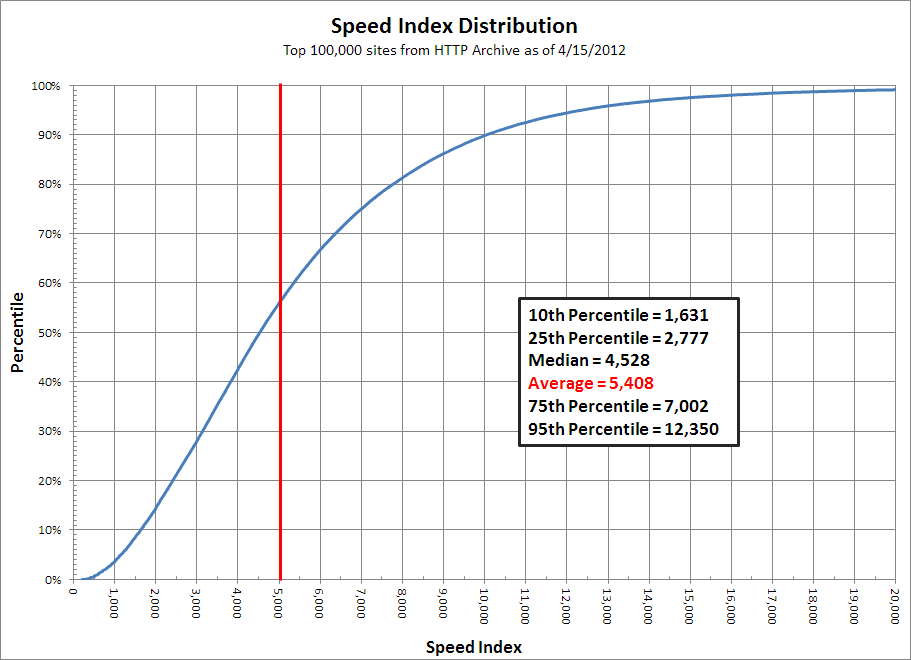
1.5Mbps DSL
Alexa top 100,000 from the testing done by the HTTP Archive: